Demos
A visual tour of what GeoLibre looks like in use. Click any screenshot to open it at full resolution, or any animation to play the full-quality video. For the complete capability list, see Features; for hands-on walkthroughs, see the Tutorials.
3D Tiles
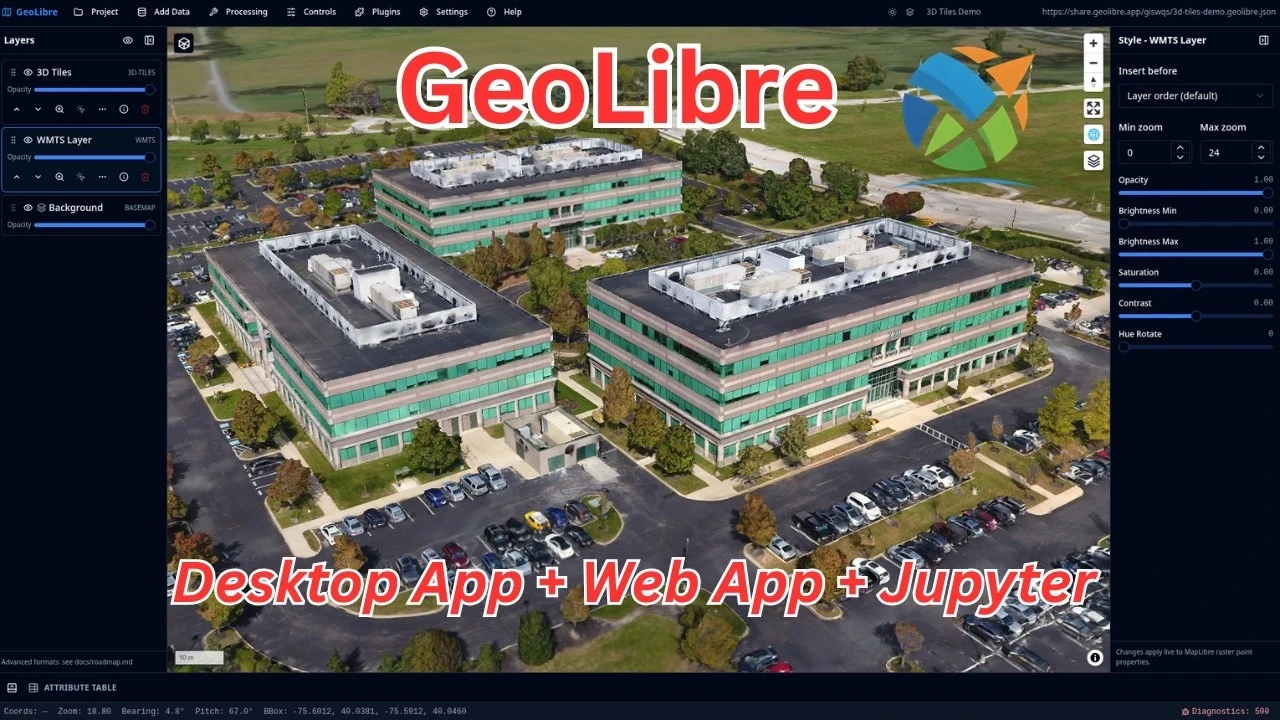
Photogrammetry and mesh datasets stream in as 3D Tiles and render on deck.gl over the MapLibre map, including authenticated tilesets via custom request headers.
NYC buildings and subways
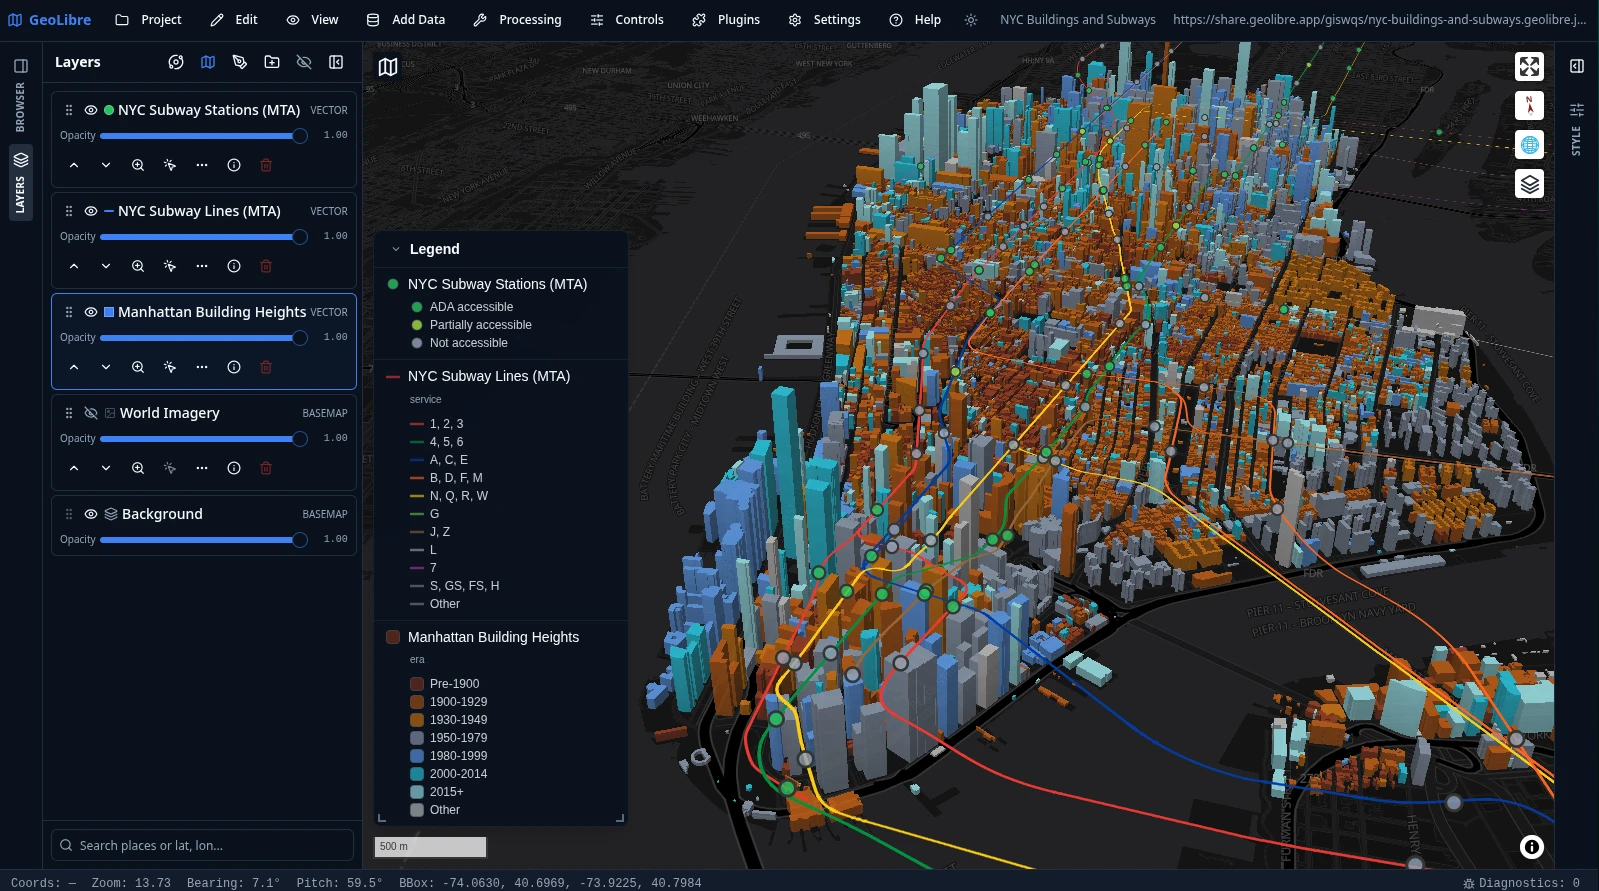
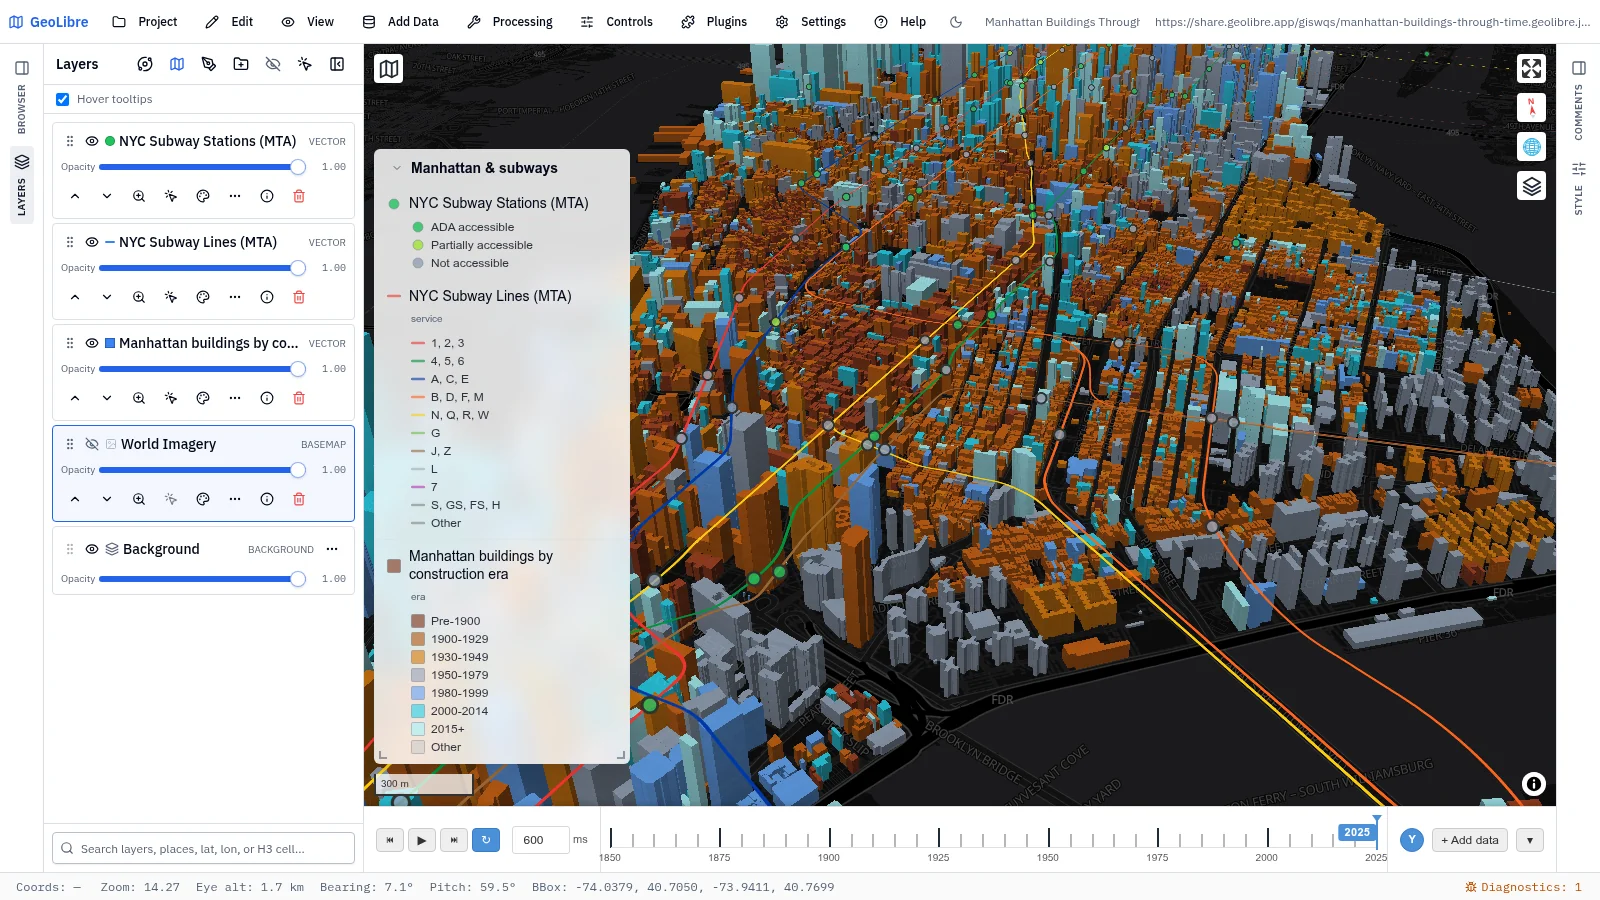
Manhattan building footprints extruded in 3D and colored by construction era, with the MTA subway lines and stations on top. The legend is generated automatically from the layers' symbology.
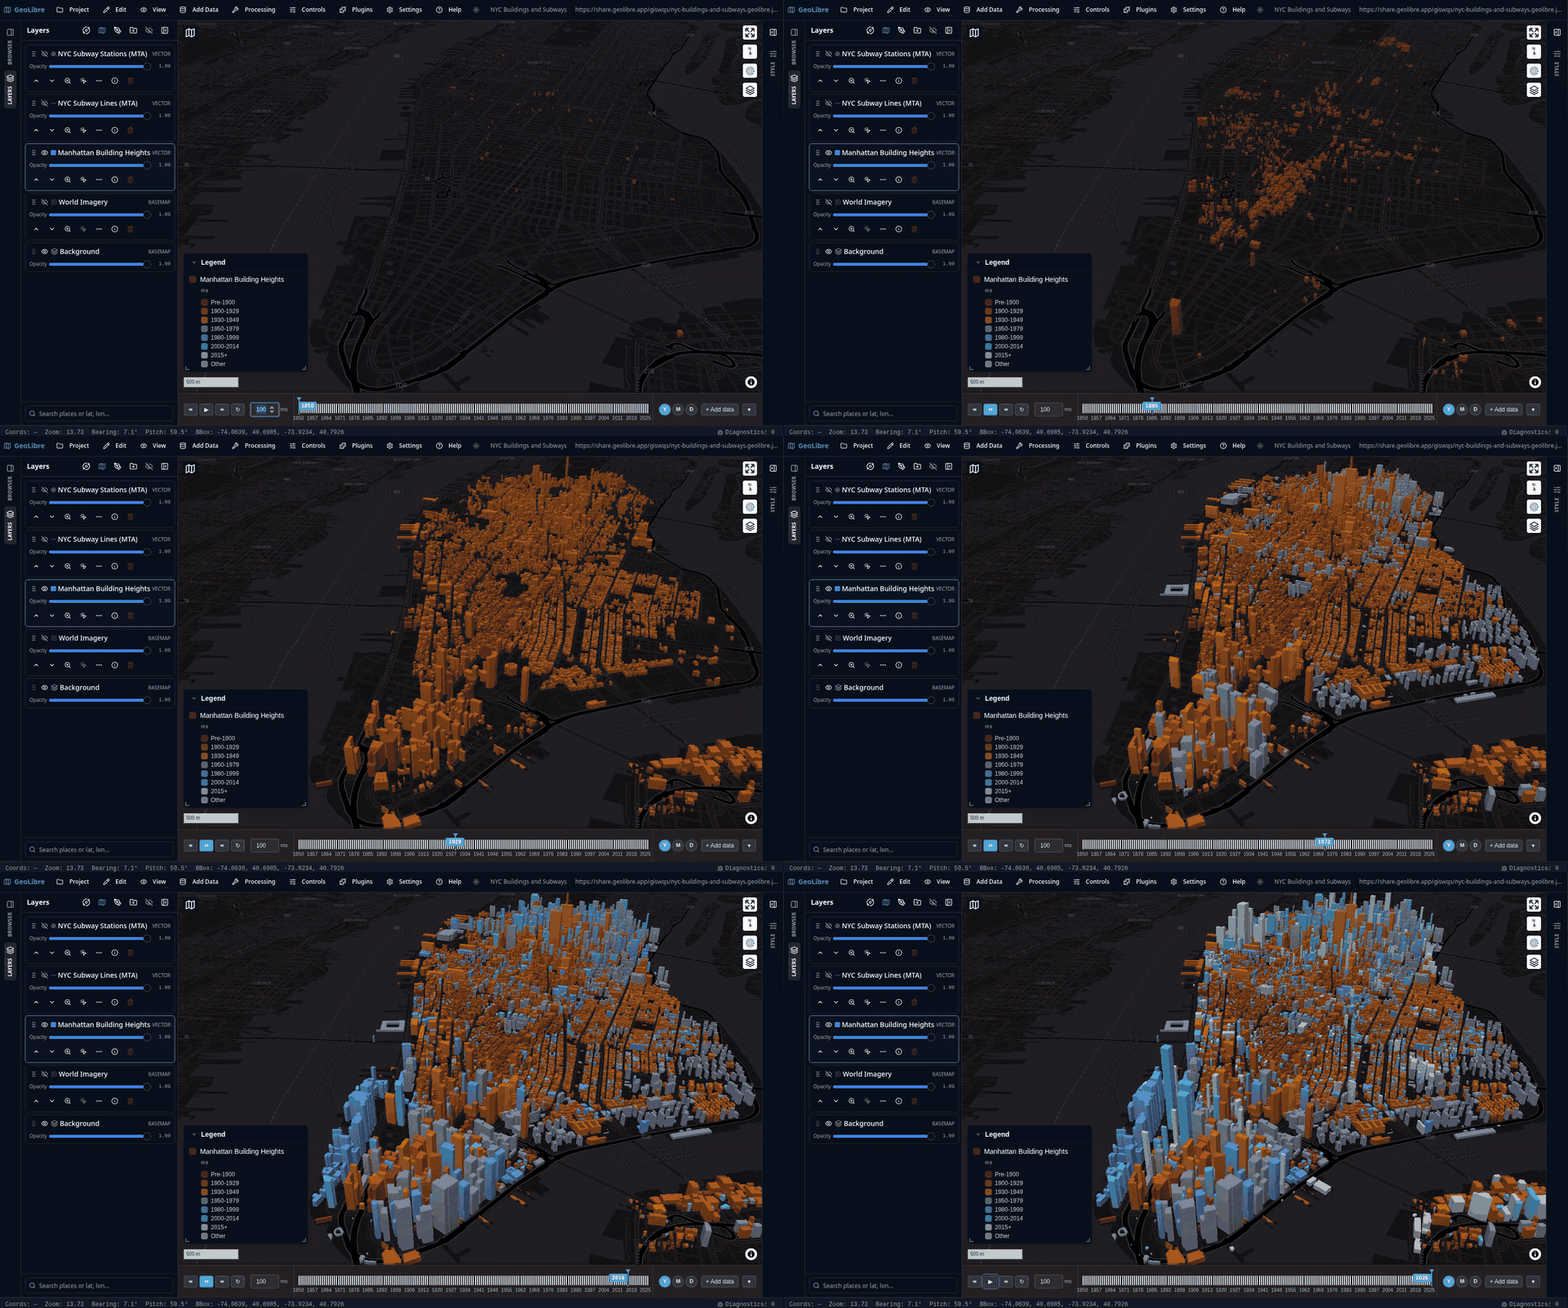
The animation below runs the Time Slider along the buildings' construction year, from 1850 to 2025, so Manhattan fills in era by era — the camera stays put and the data moves. Click it to play the full-quality video.
Planetary basemaps
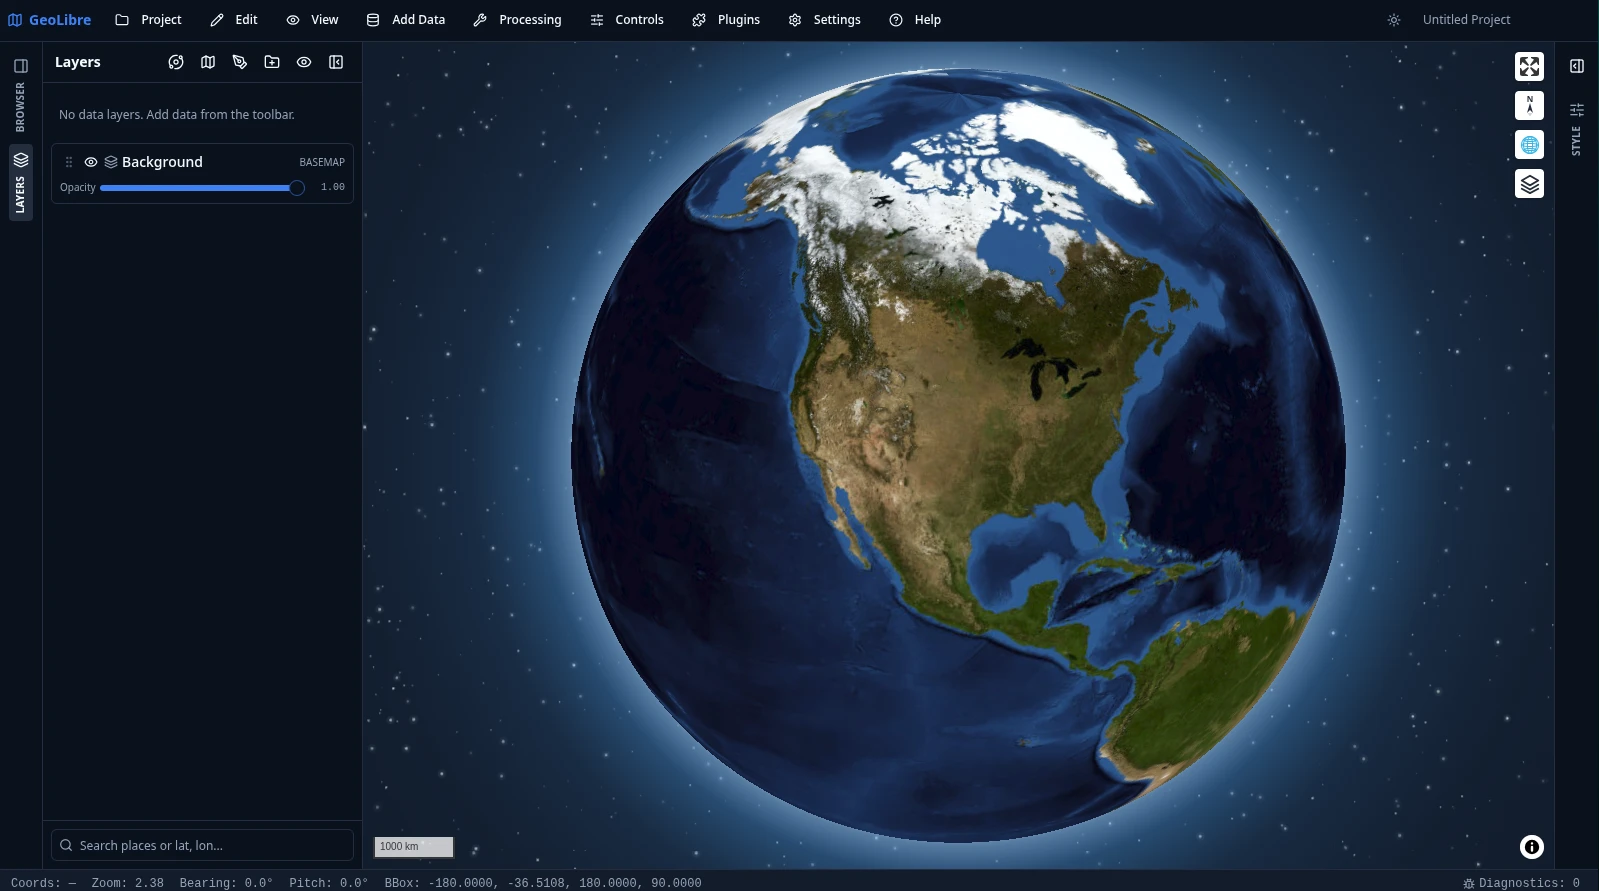
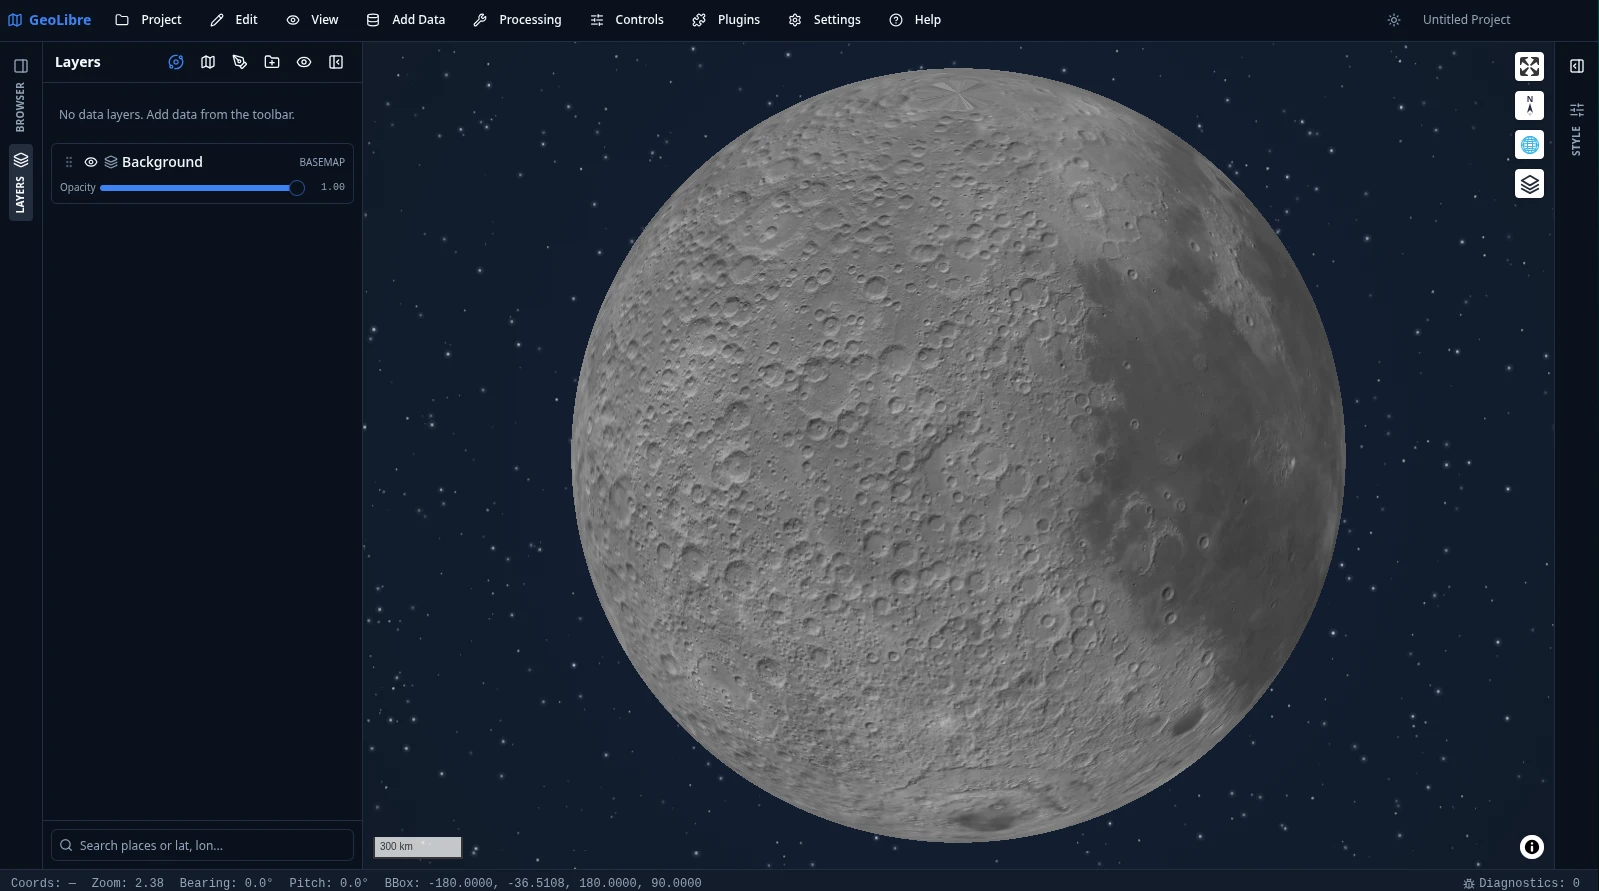
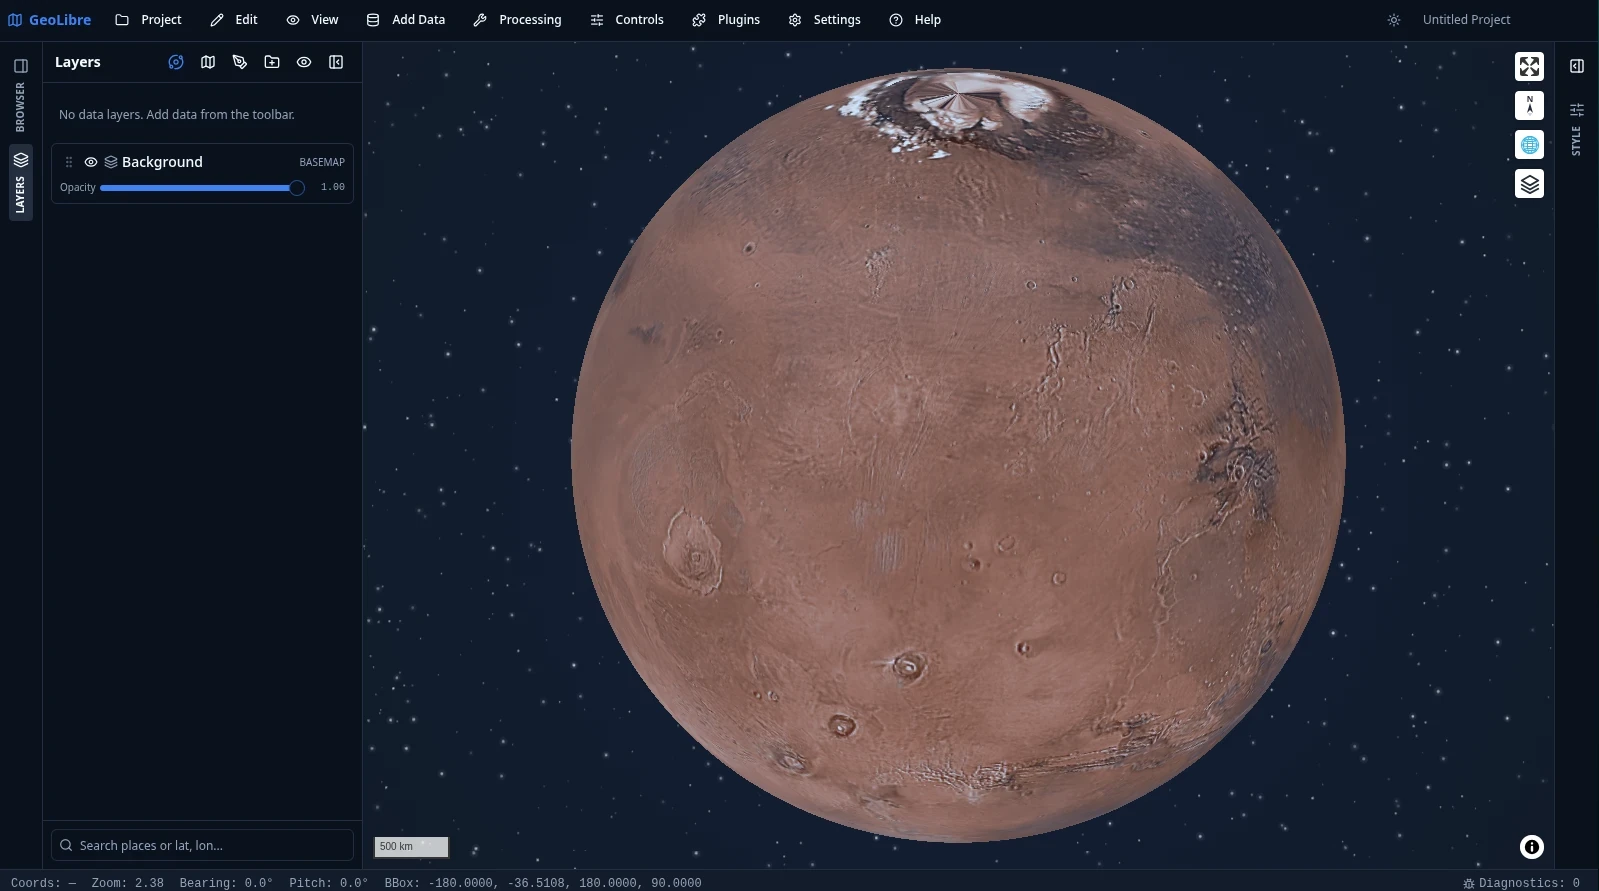
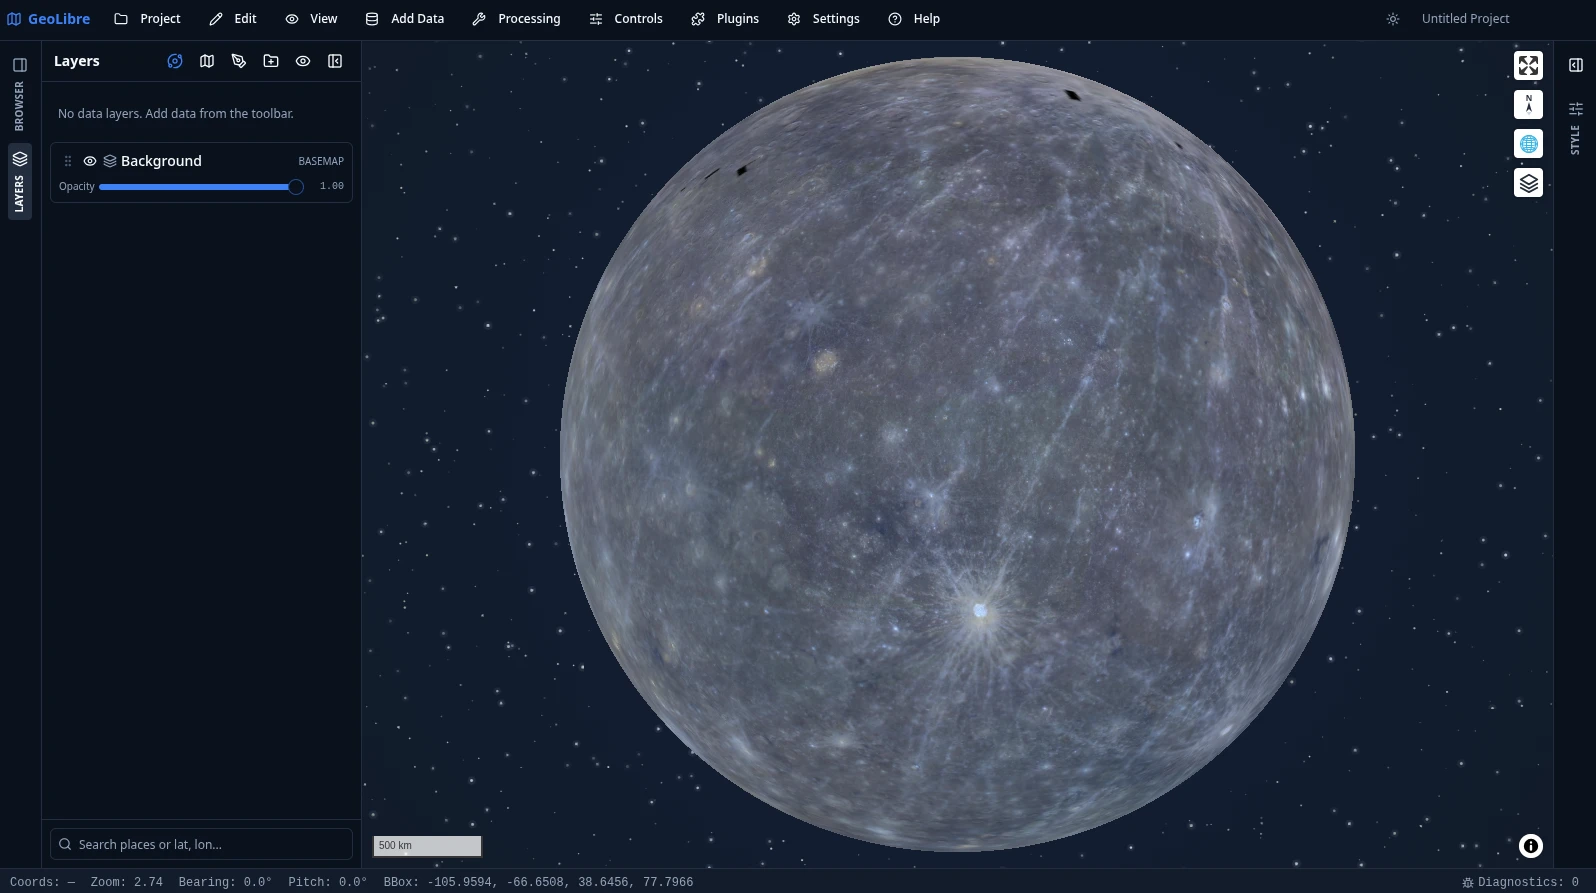
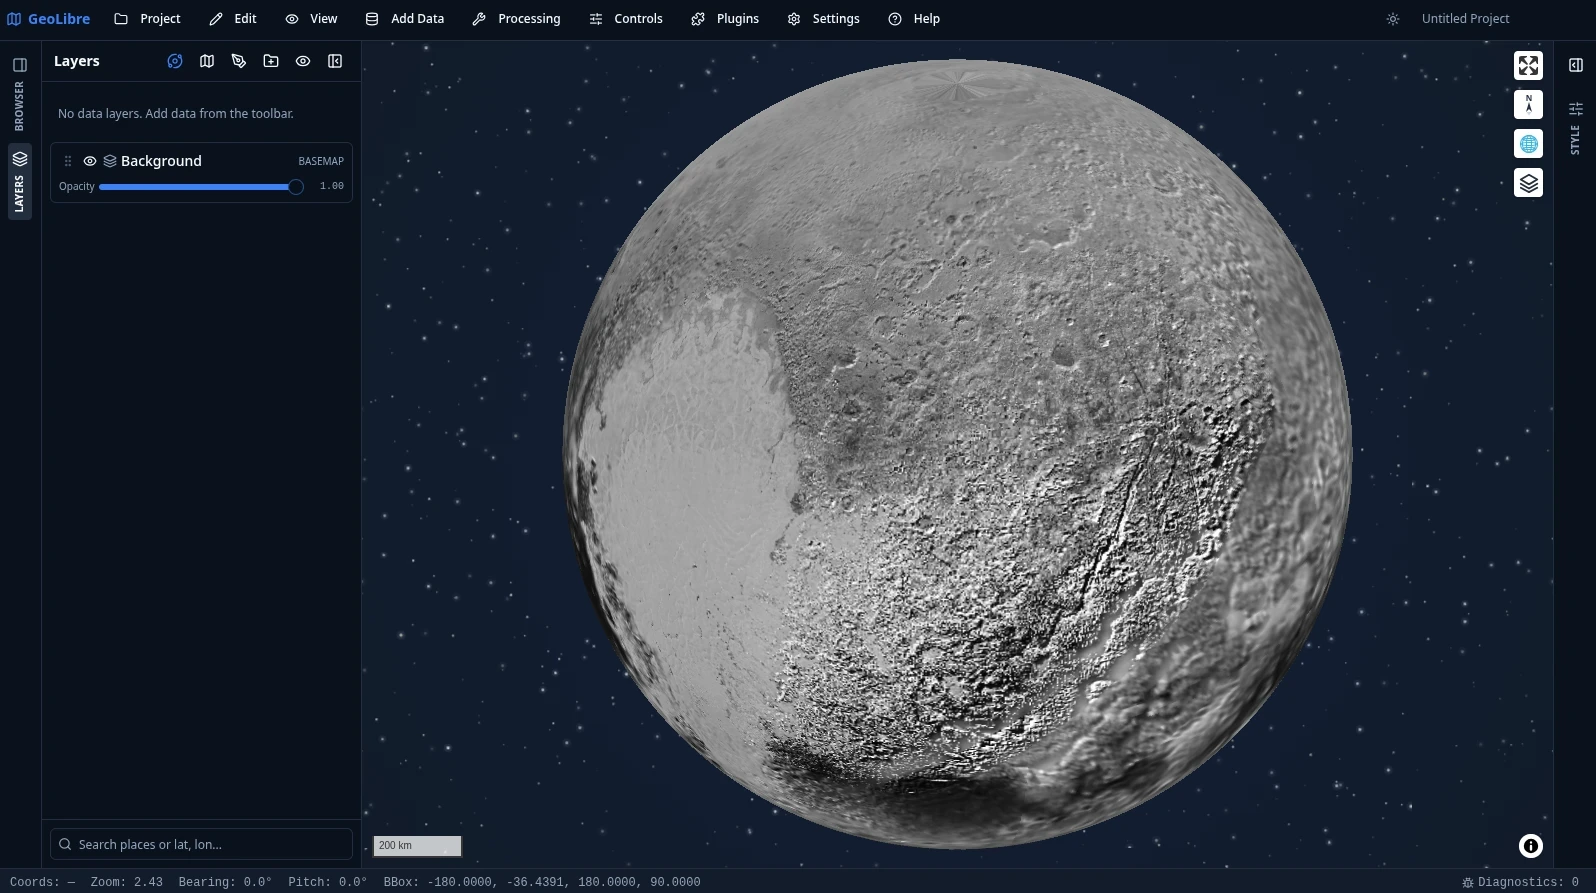
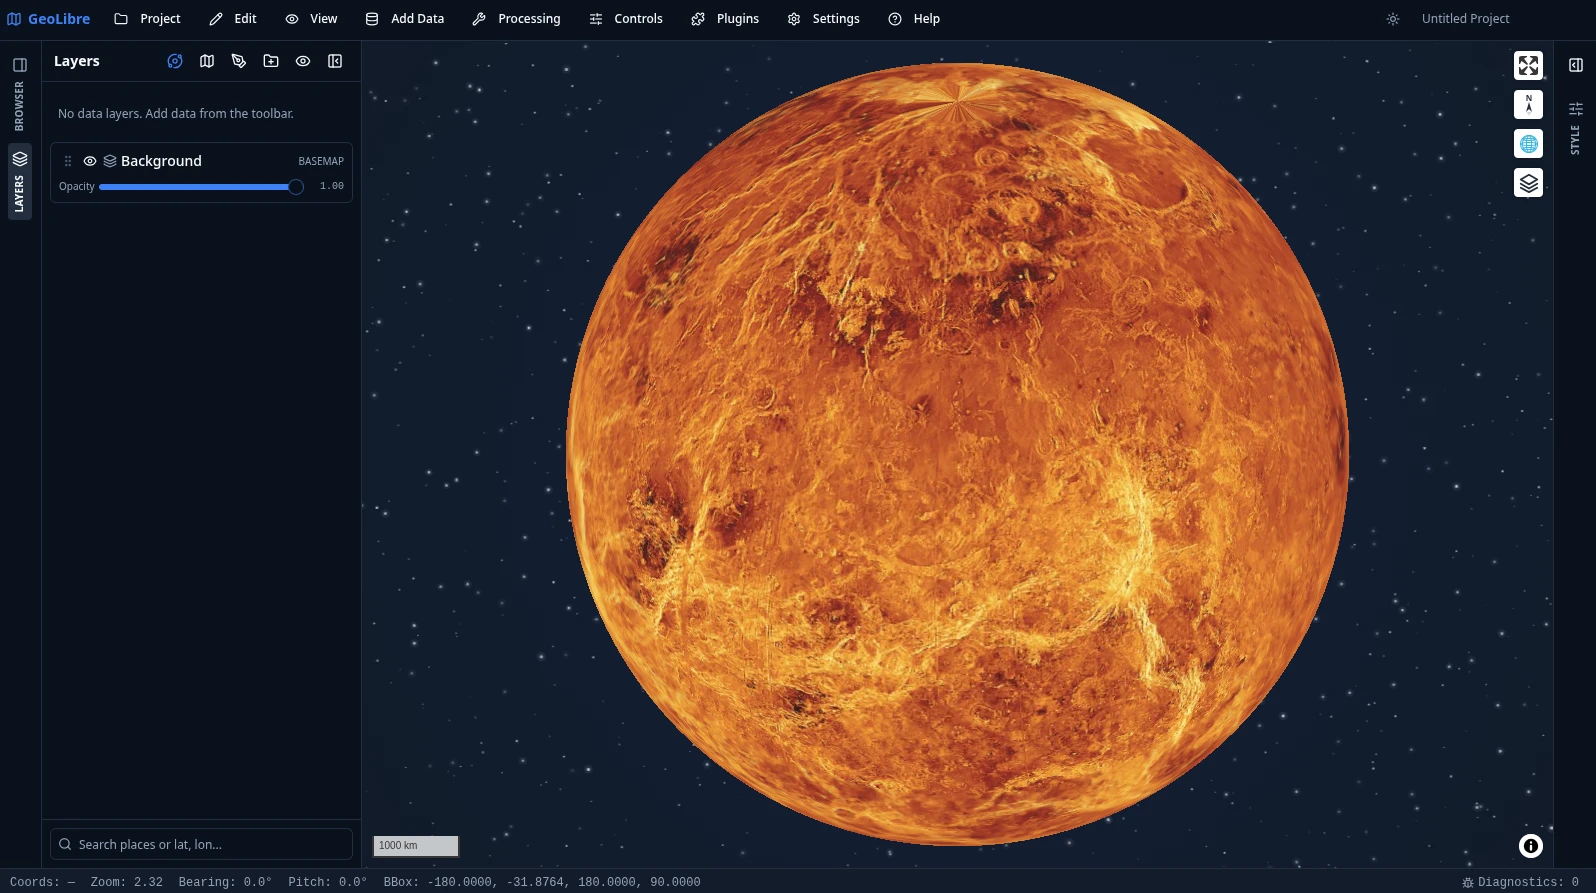
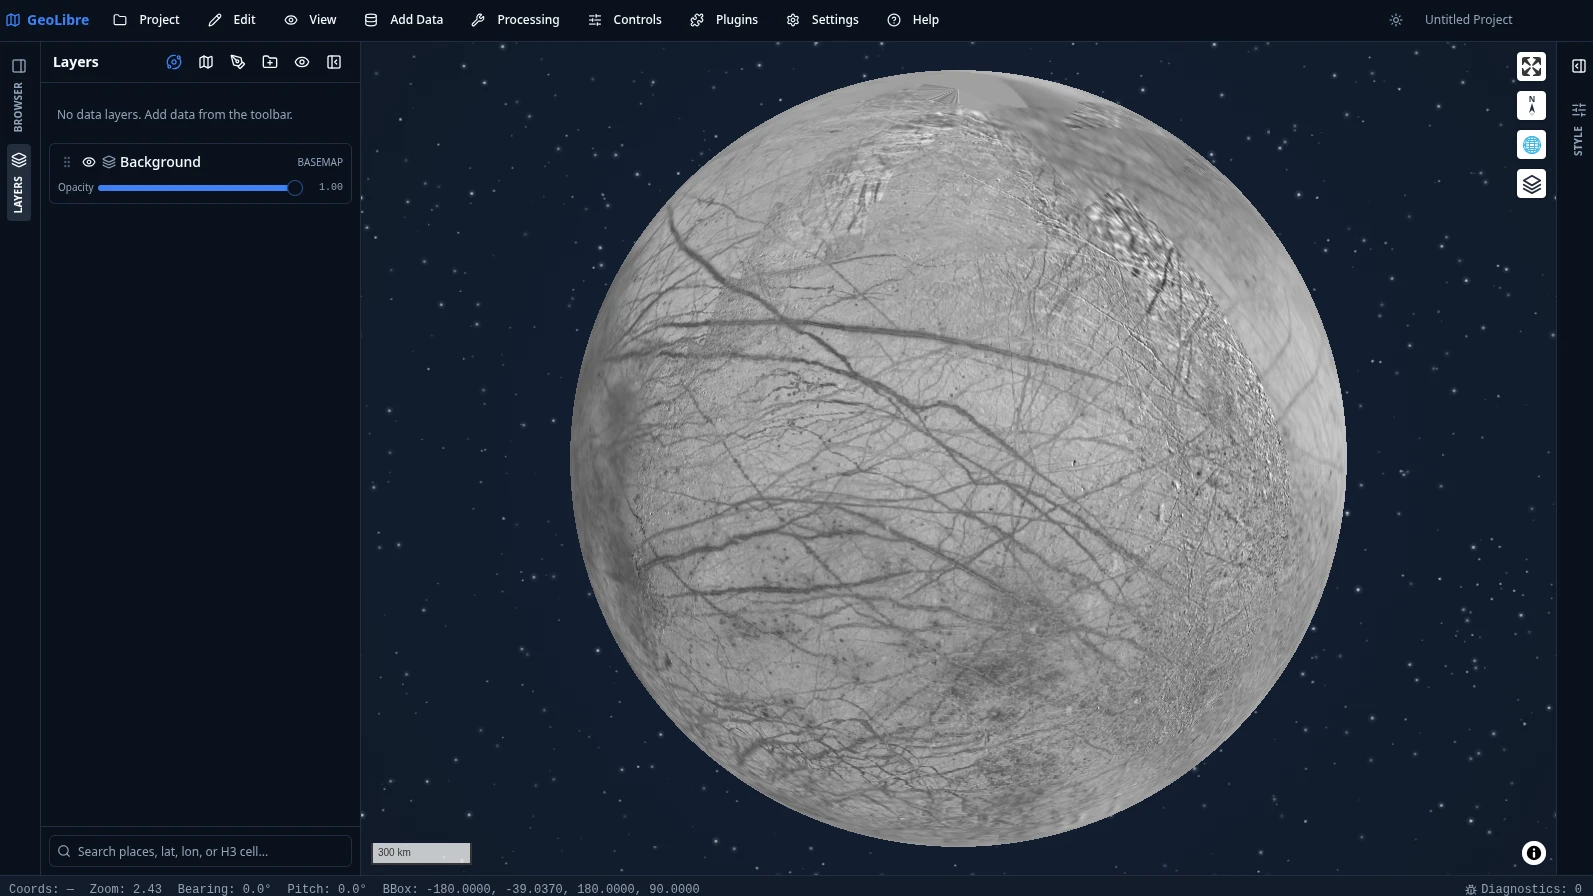
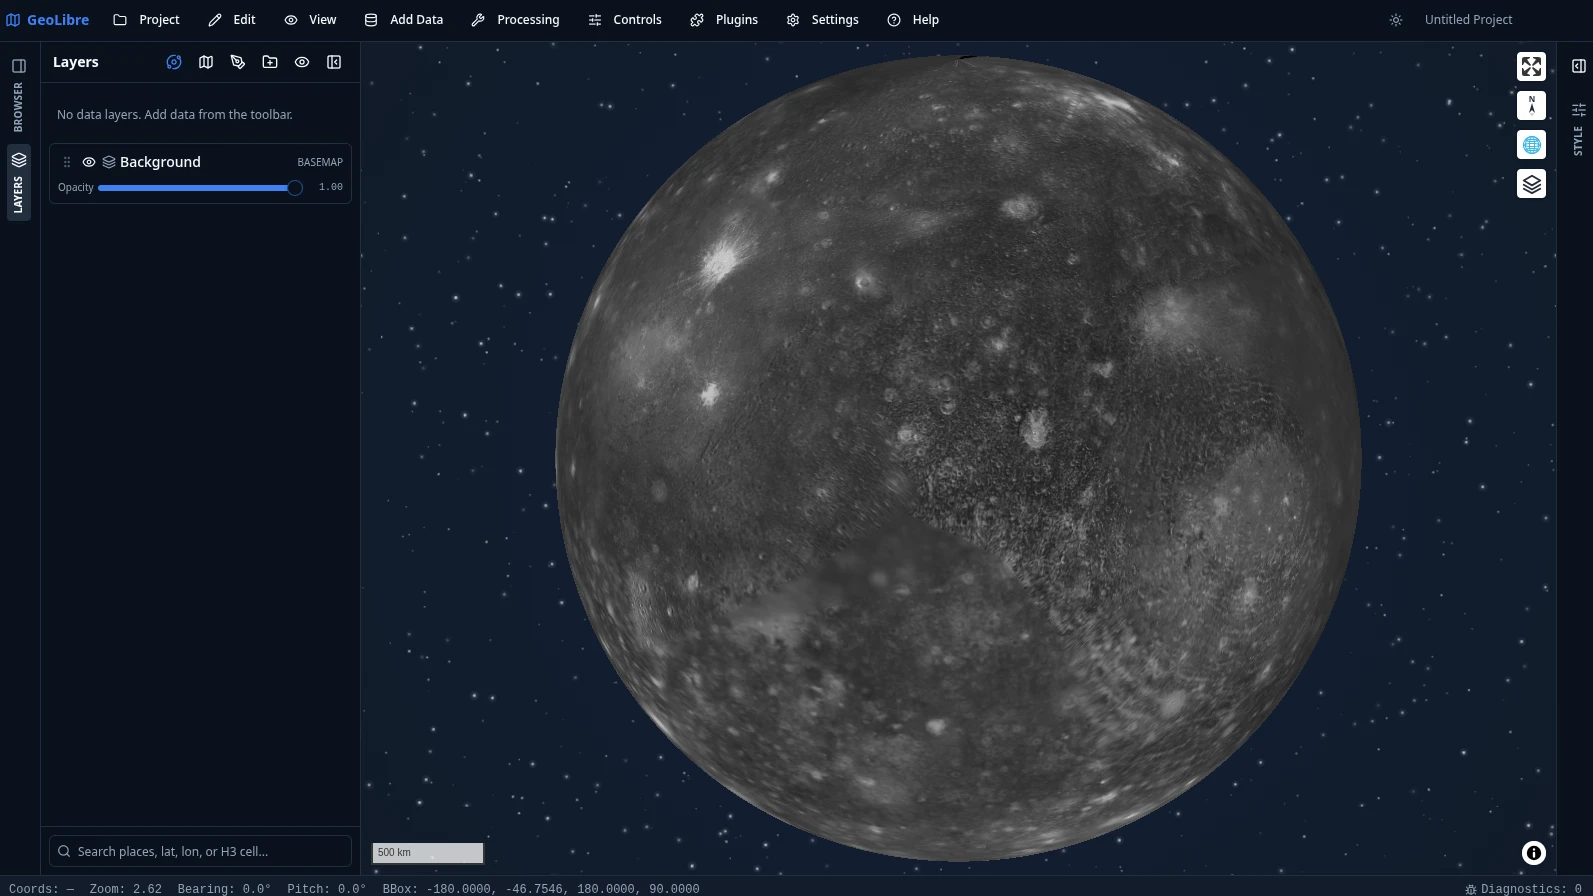
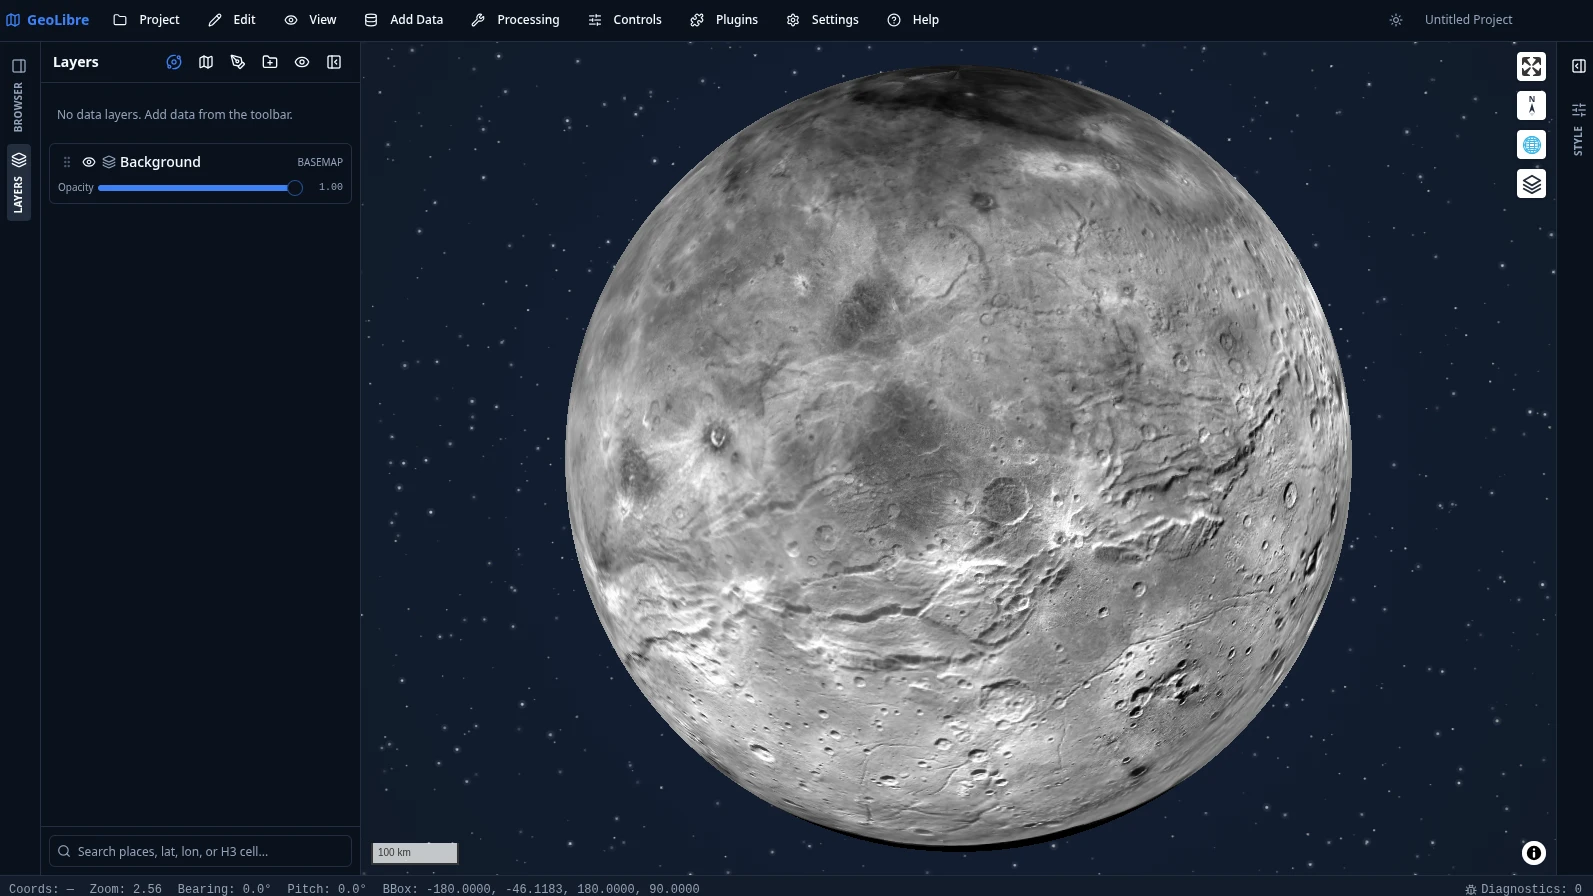
GeoLibre is not limited to Earth. Planetary basemaps from OpenPlanetaryMap and USGS Astrogeology cover the Moon, Mars, Mercury, Venus, the Galilean moons (Io, Europa, Ganymede, Callisto), Titan, Pluto, and Charon. The USGS bodies are reprojected to Web Mercator by the tiles Worker, and each project carries its own ellipsoid, so distance, area, and scale measurements match the body you are mapping. Switch bodies from the planet switcher in the Layers panel.
The deep-space starfield behind each globe comes from the Atmosphere Effects plugin.
 |
 |
 |
| Earth Street, satellite, and cloudless imagery |
Moon Hillshaded Albedo (NASA / LOLA / USGS) |
Mars Colour MOLA Elevation (NASA / MOLA) |
 |
 |
 |
| Mercury MESSENGER Colour Mosaic (NASA / JHU APL / CIW) |
Pluto New Horizons Mosaic (NASA / JHU APL / SwRI) |
Venus Magellan C3-MDIR Colour (NASA / JPL) |
 |
 |
 |
| Europa Galileo / Voyager (NASA / JPL) |
Callisto Galileo / Voyager (NASA / JPL) |
Charon New Horizons Mosaic (NASA / JHU APL / SwRI) |
Open data showcase
100 interactive maps built from public open data, from air quality and
earthquakes to Roman roads and the aurora, each a single .geolibre.json
project you can open live, explore, and fork. A few highlights:
 |
 |
| Manhattan buildings through time Urban growth · Buildings extruded at true height and replayed by construction year, 1850–2025, under the subway Data: NYC Open Data, MTA |
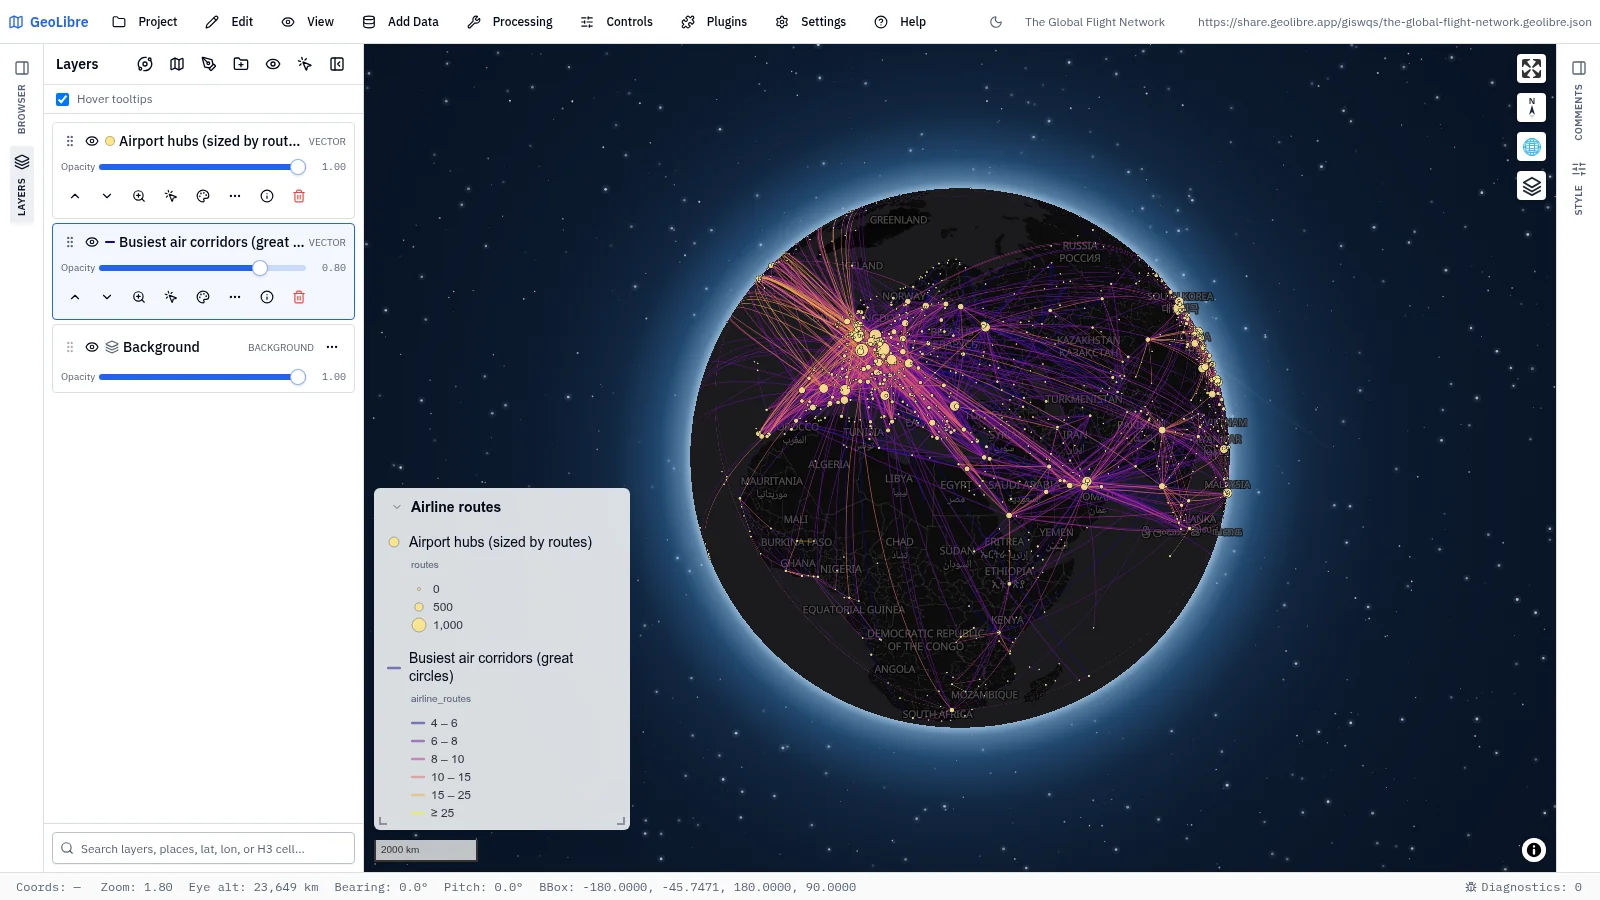
The global flight network Human mobility · The 4,000 busiest air corridors as great circles, hubs sized by routes Data: OpenFlights |
 |
 |
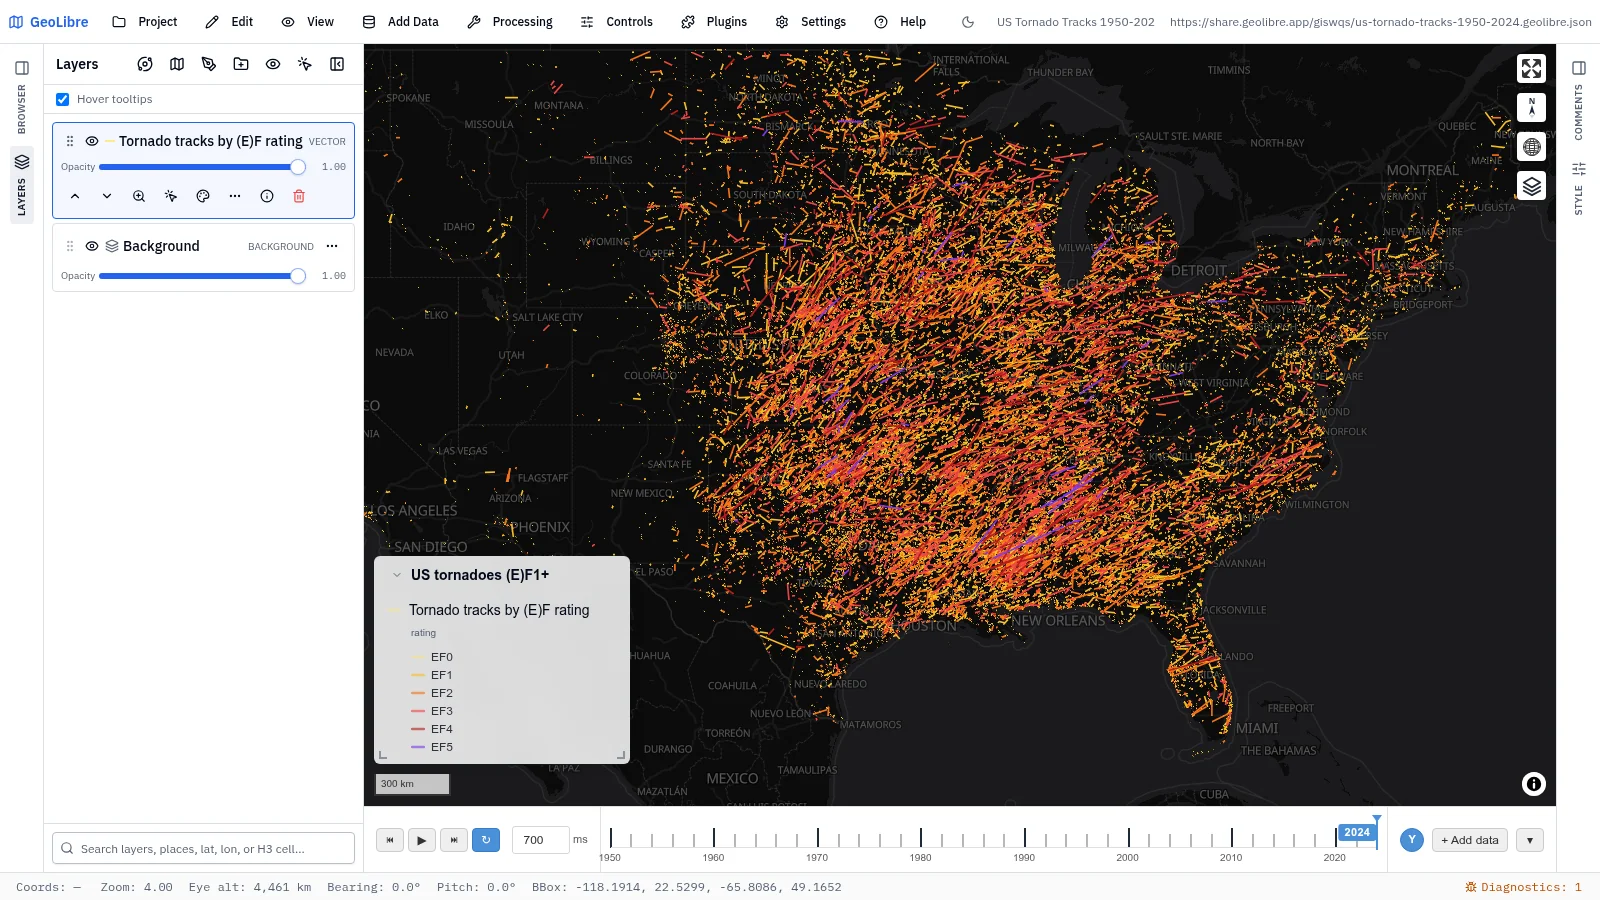
| US tornado tracks, 1950–2024 Natural hazards · (E)F1+ tracks by rating on a time slider that accumulates year by year Data: NOAA Storm Prediction Center |
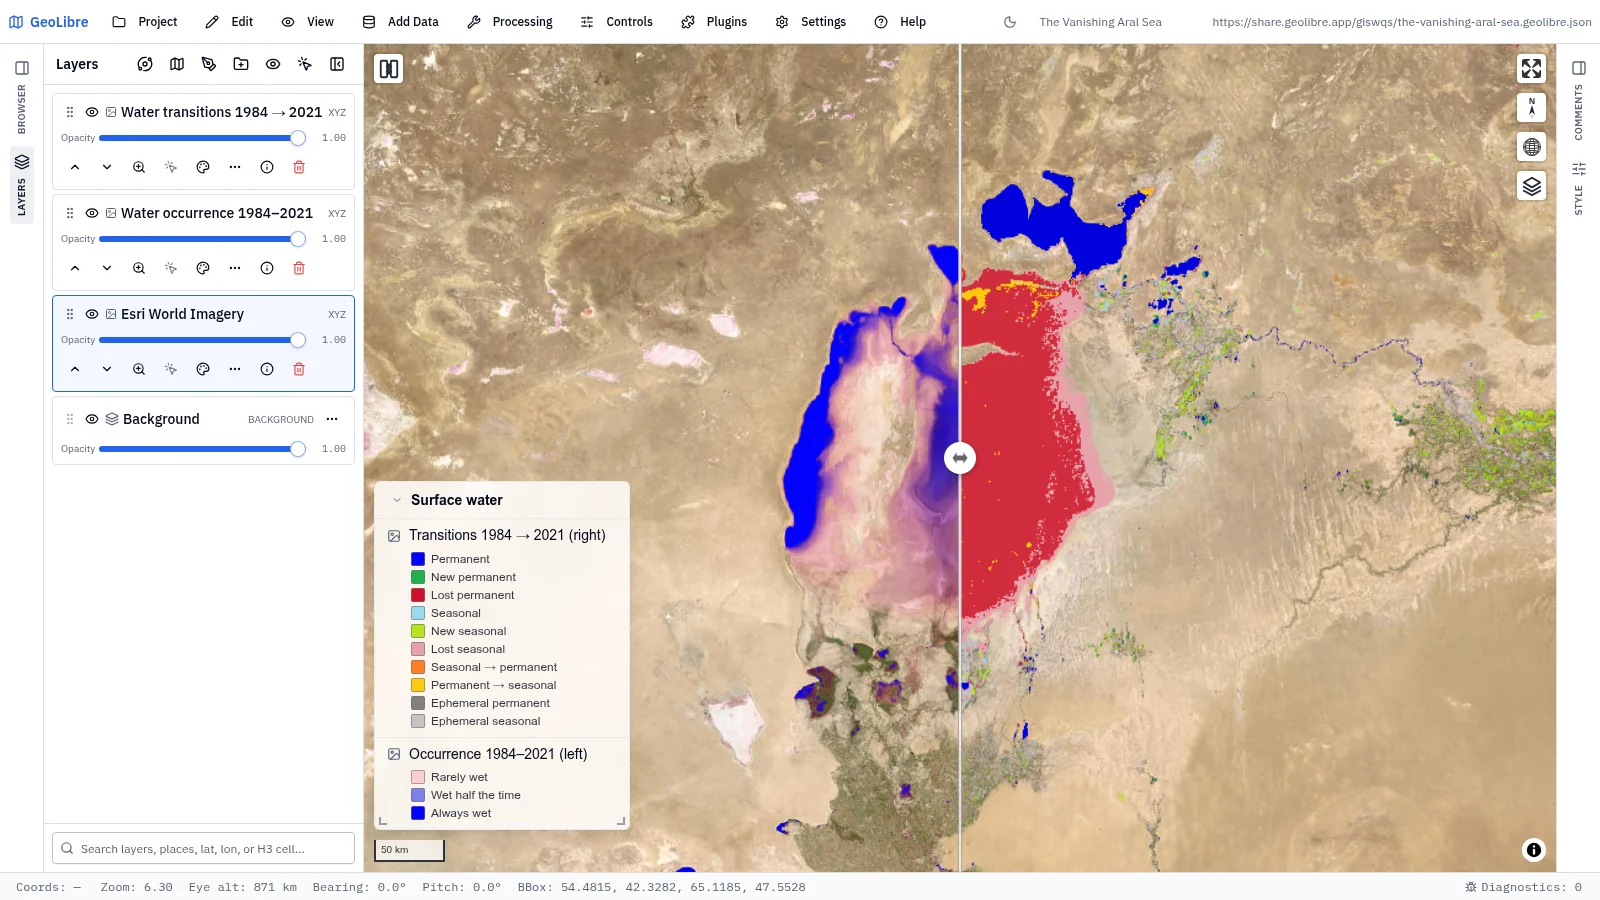
The vanishing Aral Sea Environmental change · Swipe between water occurrence and 1984–2021 transitions Data: EC JRC Global Surface Water |
 |
 |
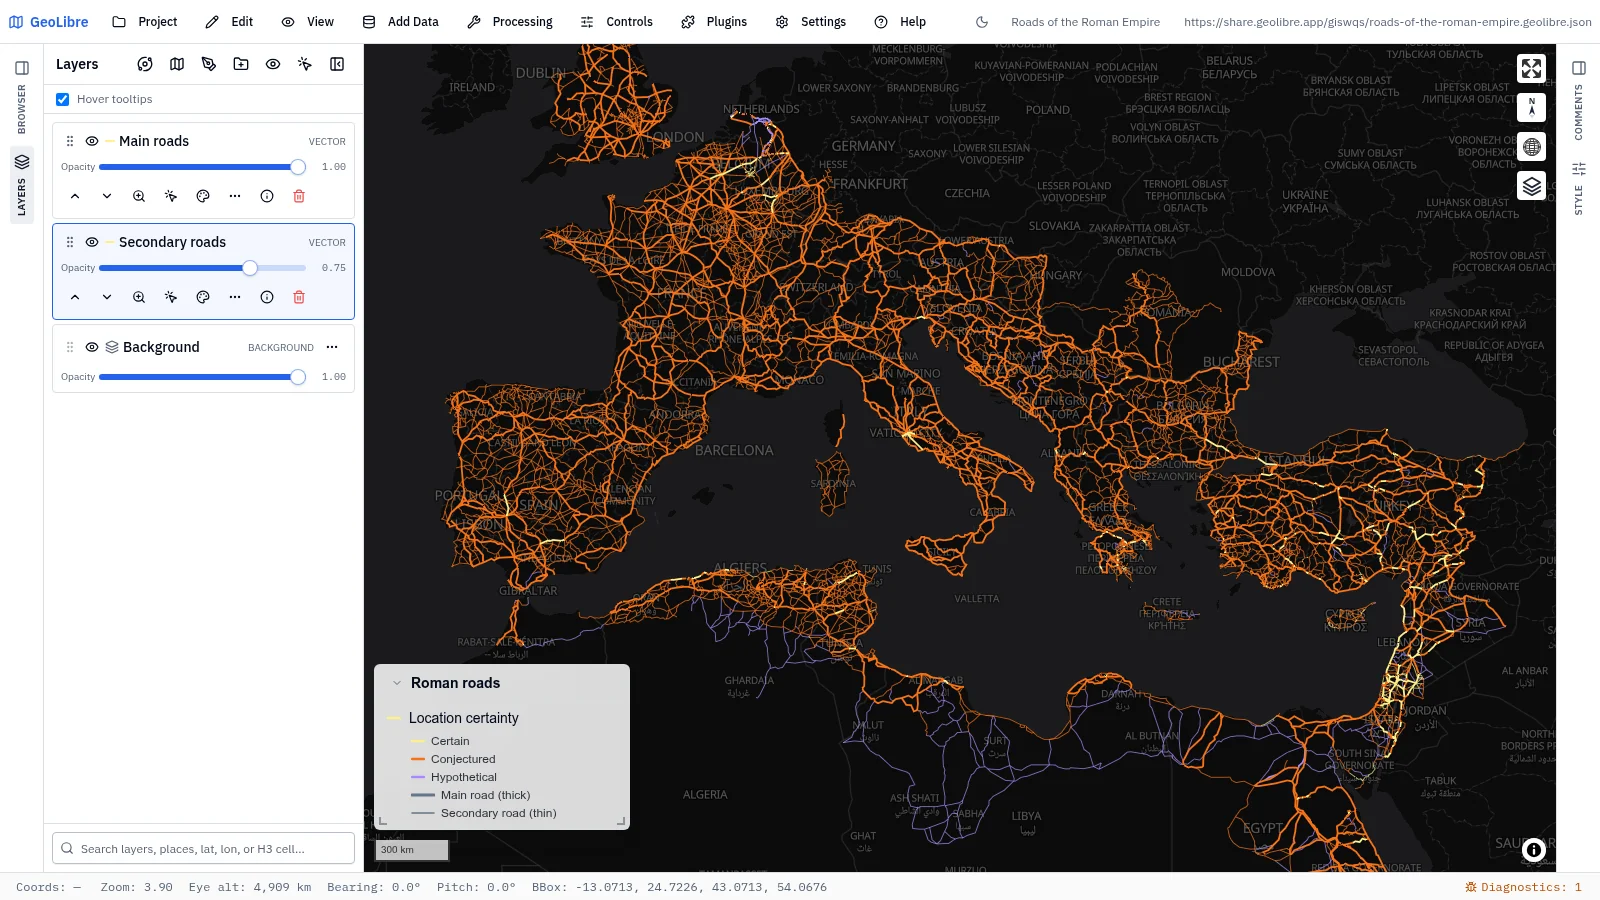
| Roads of the Roman Empire History · About 300,000 km of Roman roads by how certain the route is Data: Itiner-e |
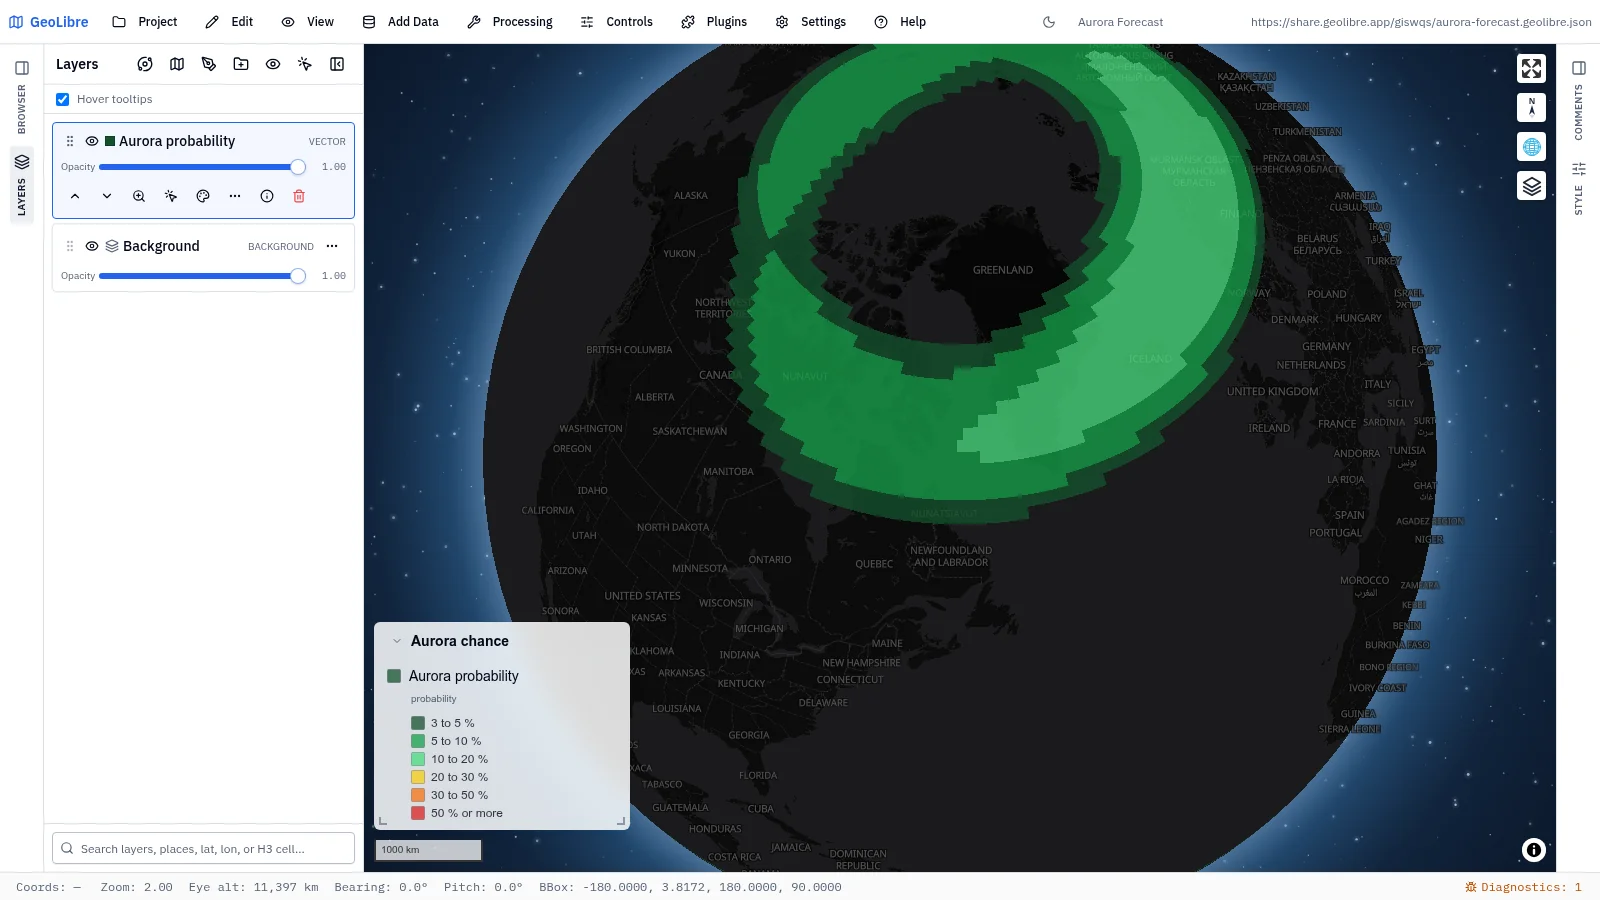
Aurora forecast Space weather · The chance of seeing an aurora, a snapshot of the OVATION model Data: NOAA SWPC |
Browse the full gallery Official Demos collection
SQL Workspace
Run DuckDB Spatial SQL against loaded layers, local files, and remote URLs without leaving the map, then add the result as a layer or export it. PostGIS (PGlite) and Apache Sedona engines are available from the same panel.
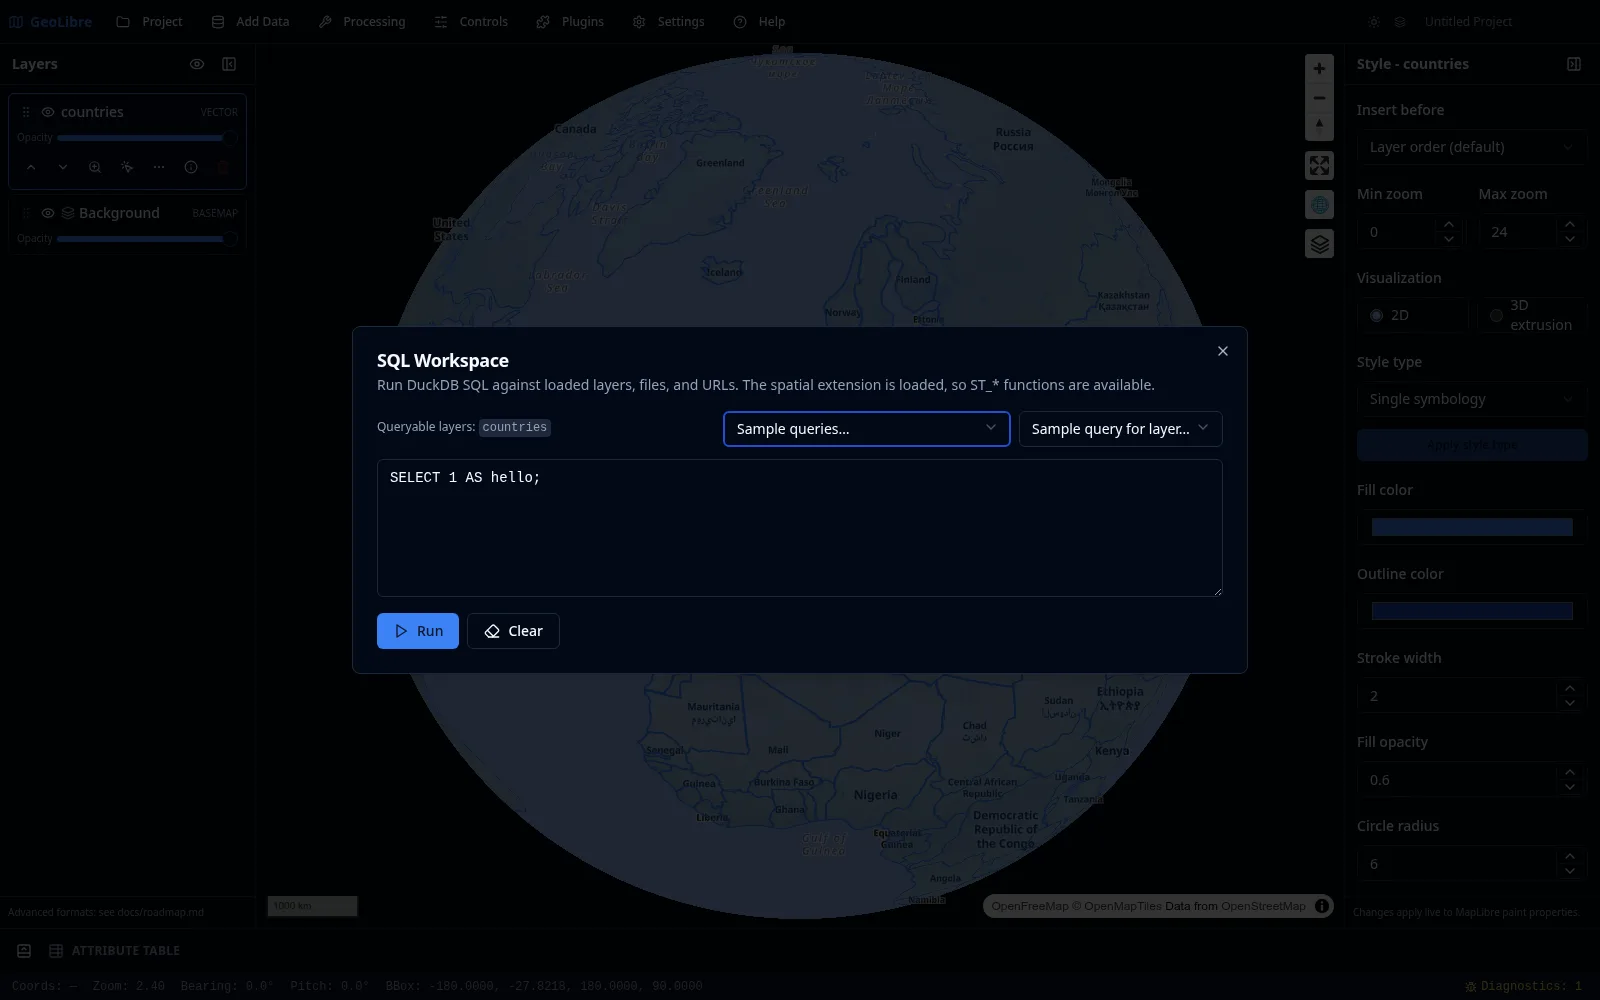
See SQL Workspace and the Spatial SQL tutorial.
Chrome-free embeds
Any shared project can be embedded with maponly for a pure map with no
toolbar, panels, or status bar.
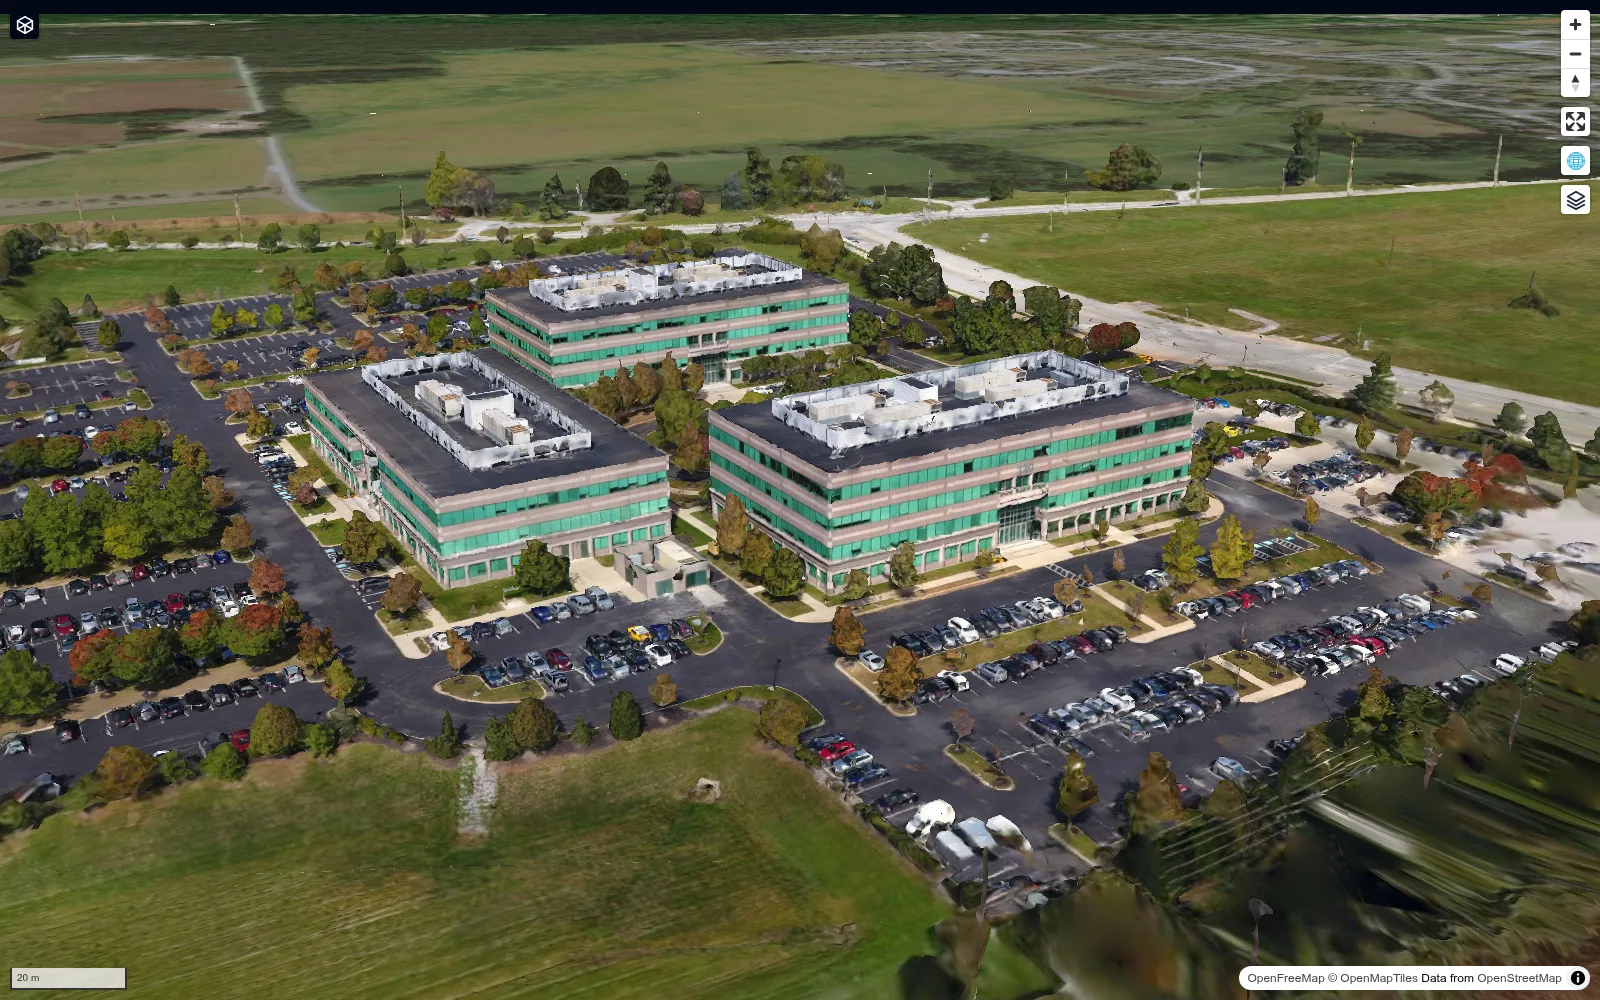
See Embedding & Sharing for every URL parameter.
Video tutorials
- GeoLibre 1.0: A Free, Open-Source Cloud-Native GIS That Runs Anywhere (Browser, Desktop & Jupyter) — a tour of the browser, desktop, and Jupyter builds.
- Geoprocessing in the Browser: 700+ Free GIS Tools in GeoLibre, Zero Install — the Whitebox toolbox running entirely on WebAssembly.
- Access Free High-Resolution Disaster Satellite Imagery in Your Browser — pre- and post-event imagery through the Vantor Open Data plugin.
- Regularize Building Footprints in the Browser with GeoLibre — squaring up AI-derived building polygons with the Rust engine.
- GeoLibre + GeoLens: A Modern GIS Stack for Self-Hosting Geospatial Data — pairing GeoLibre with GeoLens for a self-hosted geospatial data stack.
- Create Reusable GIS Workflows with GeoLibre Model Builder and AI Assistant — graphical models, including ones the AI Assistant builds from a prompt.
- Mapping the 2026 Nepal Floods with Free High-Resolution Satellite Imagery — disaster imagery from Vantor, Planet, and OpenAerialMap in one before-and-after map.
- Building Cloud-Native GIS Workflows with GeoLibre — an hour-long webinar on the cloud-native stack behind GeoLibre.
- Image Georeferencing Using GeoLibre in the Browser — pinning a scanned campus map to the basemap with ground control points.
- 100 Interactive Maps from Open Data: Explore, Fork, and Build Your Own with GeoLibre — a tour of the open data gallery: exploring, forking, and building maps like these.
All of them, with chapters and summaries, are on Video Tutorials.